Market Observations
Economy
- The Detroit Metro’s labor market remains stagnant. May’s 3.9% unemployment rate
was up 10 basis points from April levels. - Construction continues to lead employment growth fueled by infrastructure funds to
rebuild major expressways. Meanwhile, the key manufacturing sector showed
employment is 0.6% below the May 2023 levels. - Financial activities and business and professional services both showed year-over-year declines of 1.1% and 2.9%, respectively. The information showed the biggest drop
in employment, showing a 4.2 % year-over-year decline.
Leasing Market Fundamentals
- The Metro Detroit office vacancy rate climbed 10 basis points to 22.3% during the
second quarter of 2024, as just over 60,000 SF of net vacancy was added to the
market. - The bleeding appears to be slowing down in the office market. The first two quarters
of 2024 saw 328,000 SF in net vacancies compared to 1.5 million SF in mid-2023. - Available sublease space grew 7% during the second quarter of 2024 to just over 2.1
million SF.
Major Transactions
- The Sam Bernstein Law Firm leased 46,000 SF at 31440 Northwestern Hwy. in
Farmington Hills. - Lit Financial Corporation leased 10,949 SF at 3221 W. Big Beaver Rd. in Troy.
- MetLife Services and Solutions LLC leased 10,019 SF at Travelers Tower I, located at
26555 Evergreen Rd. in Southfield. - Cory J. Rubin MD PC leased 6,499 SF at 39201 Seven Mile Rd. in Livonia.
Outlook
- The market is seeing an increase in leases over 10,000 SF going into the second
quarter of 2024. Increased leasing activity could translate into net positive absorption
for the market in the coming quarters. - Despite elevated asking rates, tenants will see increasingly competitive offers from
landlords in the form of rent concessions and tenant improvement allowances. - Tenants will capitalize on competitive rates from landlords and lock in with long-term
lease deals. - The market continues to be favorable for tenants looking to purchase office buildings
as sale prices fall.
TABLE OF CONTENTS
1. Economy
2. Leasing Market Fundamentals
Economy
Metro Employment Trends Signal A Slowing Economy
The Detroit Metro’s labor market remains stagnant. May’s 3.9% unemployment rate was up 10 basis points from April levels. Compared to last year, employment levels remained
relatively unchanged. Year-over-year employment grew just 0.10%. The unemployment rate remains lower than the 5.7% 10-year historical average.
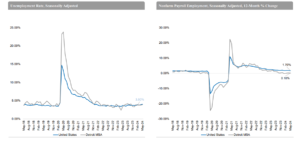
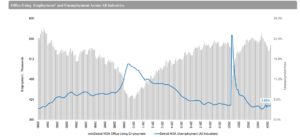
Office-Using Employment Down from Last Year
Office sector employment didn’t show much gain in May 2024. Employment levels are down in year-over-year comparisons.
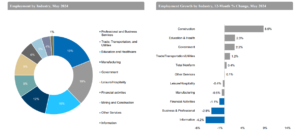
Overall Office-Using Employment
While year-over-year office-using employment is down, figures are showing improvement over the past several months. Office employment grew 2.6% from January to May 2024. Year
over the year, employment is still down 4.6% from its peak in June 2023.
Leasing Market Fundamentals
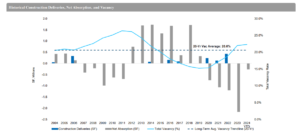
Vacancy Rate Beginning to Level Out
The Metro Detroit office vacancy rate climbed 10 basis points to 22.3% during the second quarter of 2024 as just over 60,000 SF of net vacancies were added to the market. The
bleeding appears to be slowing down in the office market. The first two quarters of 2024 saw 328,000 SF in net vacancies compared with 1.5 million SF in mid-2023.
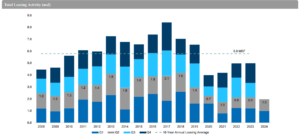
Leasing Activity Poised to Rebound
Overall leasing activity continues to be below pre-COVID levels in the Detroit Metro area. Tenant demand for space declined sharply following 2019 as office users cut occupancy
costs by reducing space. Recently companies have begun to take advantage of reduced occupancy costs and sign new lease space as landlords are offering greater concessions
on larger leases. Smaller users continue to be active in the market. The coming quarters are likely to see increased leasing activity as more companies realize savings and lock in
longer terms.
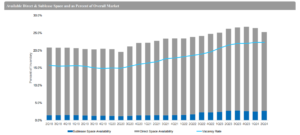
Direct Available Space Dips While Sublease Levels Grow
Available sublease space grew 7% during the second quarter of 2024 to just over 2.1 million SF as companies continue to shed excess floor capacity.
Construction Continues on the City of Detroit’s Newest High-Rise
Construction on Bedrock’s new high-rise on the former Hudson site at Woodward and Gratiot Avenues continues. The 680-foot-tall mixed-use development will feature a 400,000-SF
block of Class A office space, along with residential, hotel, and retail components. The new tower will likely be completed in 2024.
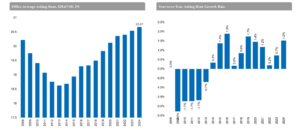
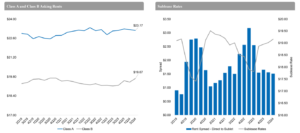
Average Asking Rents Pause Upward Trend
Despite a slew of space coming on the market since the pandemic from companies downsizing, asking rents haven’t shown much downward movement. On the contrary, the average
asking rate has climbed as more high-quality space is added to the market. The market is finally seeing a pause in the upward trend. Landlords continue to incentivize tenants with
increasingly competitive offers in the form of rent concessions that include free rent and tenant improvement allowances.
Asking Rates Mostly Unchanged
In past cycles, asking rents have adjusted downward to account for depressed demand; however, asking rents have largely remained unchanged since the onset of the pandemic.
Landlords have traded rent reductions with increased lease incentives, including greater free rent periods and TI packages. Sublease rents have mostly declined since 2021 before the
market was saturated with space. An increase in Class A sublease space has driven the average up over the past few quarters.
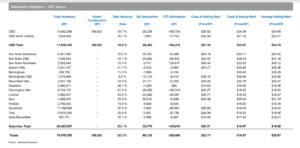
2Q 2024 Overall Metro Detroit Office Market Stats